Financial benchmarking is a powerful tool that enables businesses to measure their performance against industry standards, competitors, or even their own historical data. By analyzing key financial metrics, such as profitability, efficiency, and liquidity, companies can identify strengths, uncover areas needing improvement, and make more informed strategic decisions. Whether you’re aiming to optimize resources, set realistic goals, or gain a competitive edge, financial benchmarking offers a structured approach to understand how your business stands in a fast-changing market. Through this process, businesses don’t just evaluate their current standing; they uncover actionable insights that drive growth and long-term success.

Why Financial Benchmarks are Important
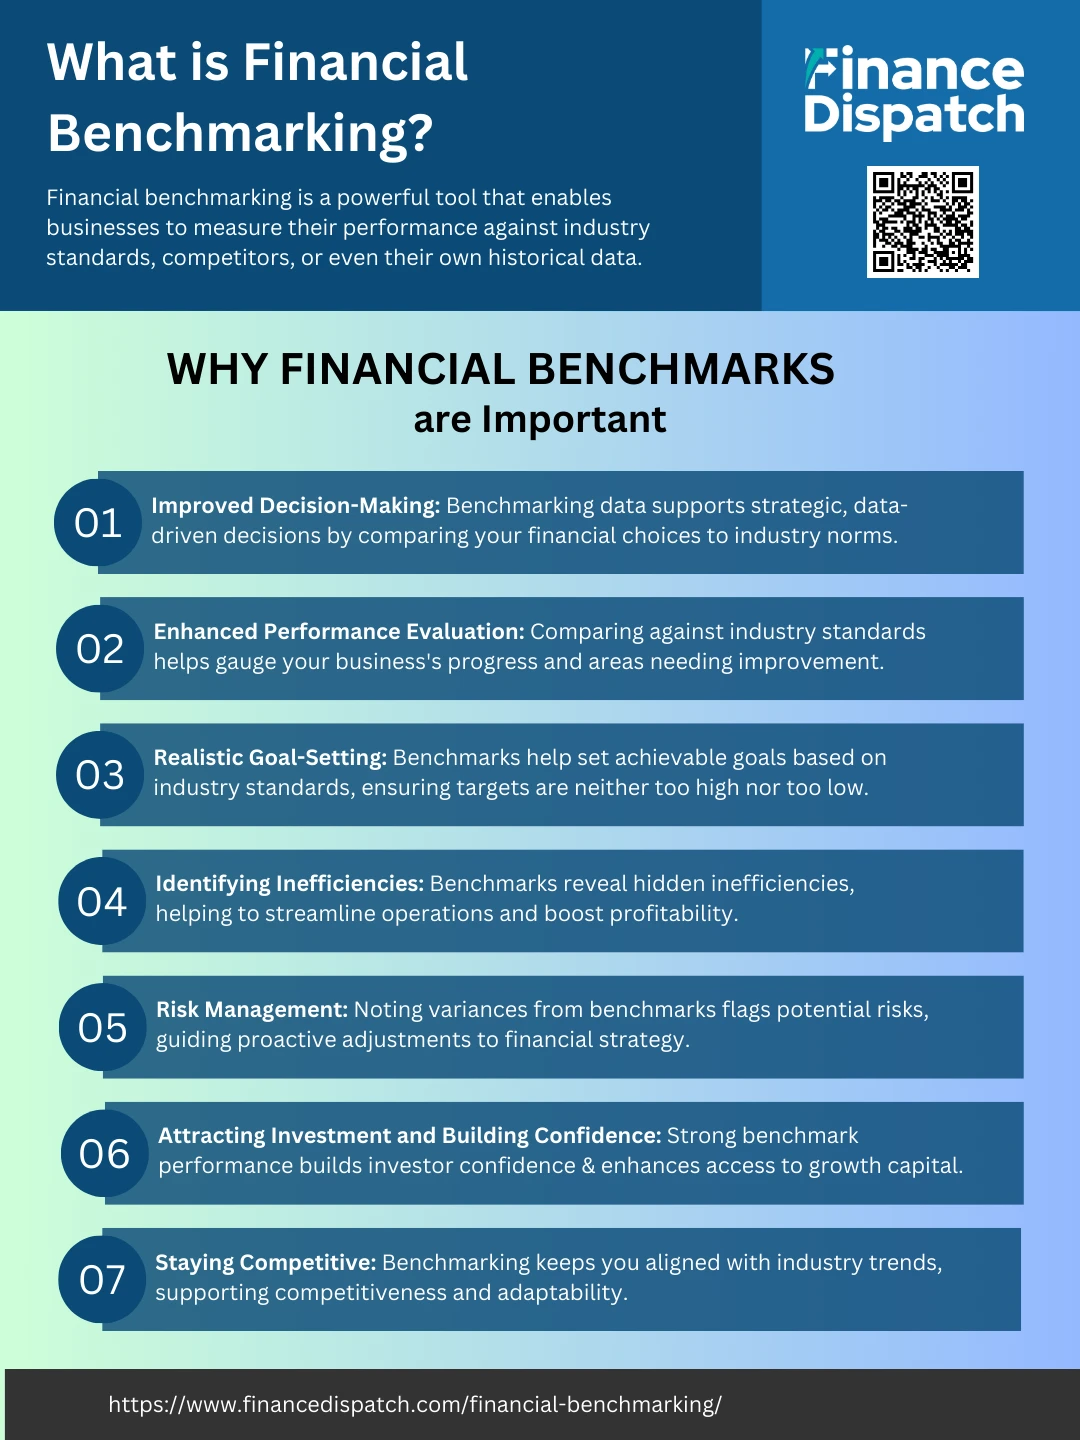
Financial benchmarks are essential because they provide a clear, objective view of where your business stands in relation to competitors and industry standards. By comparing your financial performance to these benchmarks, you gain valuable insights that can guide decision-making, highlight areas for improvement, and help set realistic, achievable goals. Here are some key reasons why financial benchmarks are crucial for your business:
1. Improved Decision-Making
Financial benchmarks provide a framework for making strategic choices based on facts rather than assumptions. With benchmarking data, you can analyze your spending patterns, profitability ratios, and productivity metrics in the context of industry standards, allowing you to see where your decisions may be yielding better or worse results than expected. This insight helps prioritize initiatives that deliver the highest returns, optimize budgets, and allocate resources where they are most needed. The end result is a more efficient, data-driven decision-making process that enhances your company’s long-term success.
2. Enhanced Performance Evaluation
Benchmarking your financial performance against industry norms enables regular and precise evaluations of your company’s progress. It reveals areas where you’re performing well, such as strong revenue growth or above-average margins, and areas needing attention, like high operational costs or low asset turnover. Through this comparison, you can recognize trends that indicate progress or expose emerging issues, providing a clear picture of your company’s trajectory and making it easier to stay focused on both current performance and future improvement.
3. Realistic Goal-Setting
Setting goals without an understanding of where your company stands relative to industry peers can result in targets that are either too ambitious or too conservative. By comparing your performance to established benchmarks, you can create achievable goals grounded in data, helping your team to push toward improvement without feeling overwhelmed or under-challenged. For instance, knowing your industry’s average profit margin or inventory turnover rate can set a realistic baseline for what to aim for and motivate employees to reach specific, attainable milestones.
4. Identifying Inefficiencies
Financial benchmarks highlight inefficiencies that may not be obvious when only internal data is reviewed. Comparing cost structures, for instance, can reveal if your spending on materials, labor, or overhead is out of line with industry norms. Similarly, examining turnover ratios or expense ratios can signal if you’re lagging in productivity or over-allocating resources. Identifying these inefficiencies enables you to make targeted adjustments, streamlining operations, cutting unnecessary costs, and ultimately improving profitability.
5. Risk Management
Variances between your financial metrics and industry benchmarks can signal potential risks. For example, if your debt-to-equity ratio is significantly higher than the industry average, it might indicate financial overextension, which could jeopardize your stability in challenging economic times. By identifying such discrepancies, you can address underlying issues before they escalate, adjusting your financial strategy to minimize risk and ensure greater resilience.
6. Attracting Investment and Building Confidence
Financial benchmarks not only provide clarity to internal stakeholders but also serve as a valuable tool for external investors. Exceeding benchmarks in key areas, such as return on investment (ROI) or liquidity ratios, signals financial health and sound management practices, making your business more attractive to potential investors or partners. This strengthens your business’s reputation, builds confidence among existing stakeholders, and can lead to greater access to capital for growth.
7. Staying Competitive
Financial benchmarking keeps you informed on best practices and industry trends, ensuring that your strategies and operations evolve with the market. By aligning your performance with top industry standards, you can implement successful tactics that leading companies use, stay adaptable to market shifts, and avoid falling behind in a competitive landscape. Continuous benchmarking helps you stay agile, aware of new opportunities, and responsive to customer demands, securing a long-term competitive advantage.

Key Methods for Financial Benchmarking
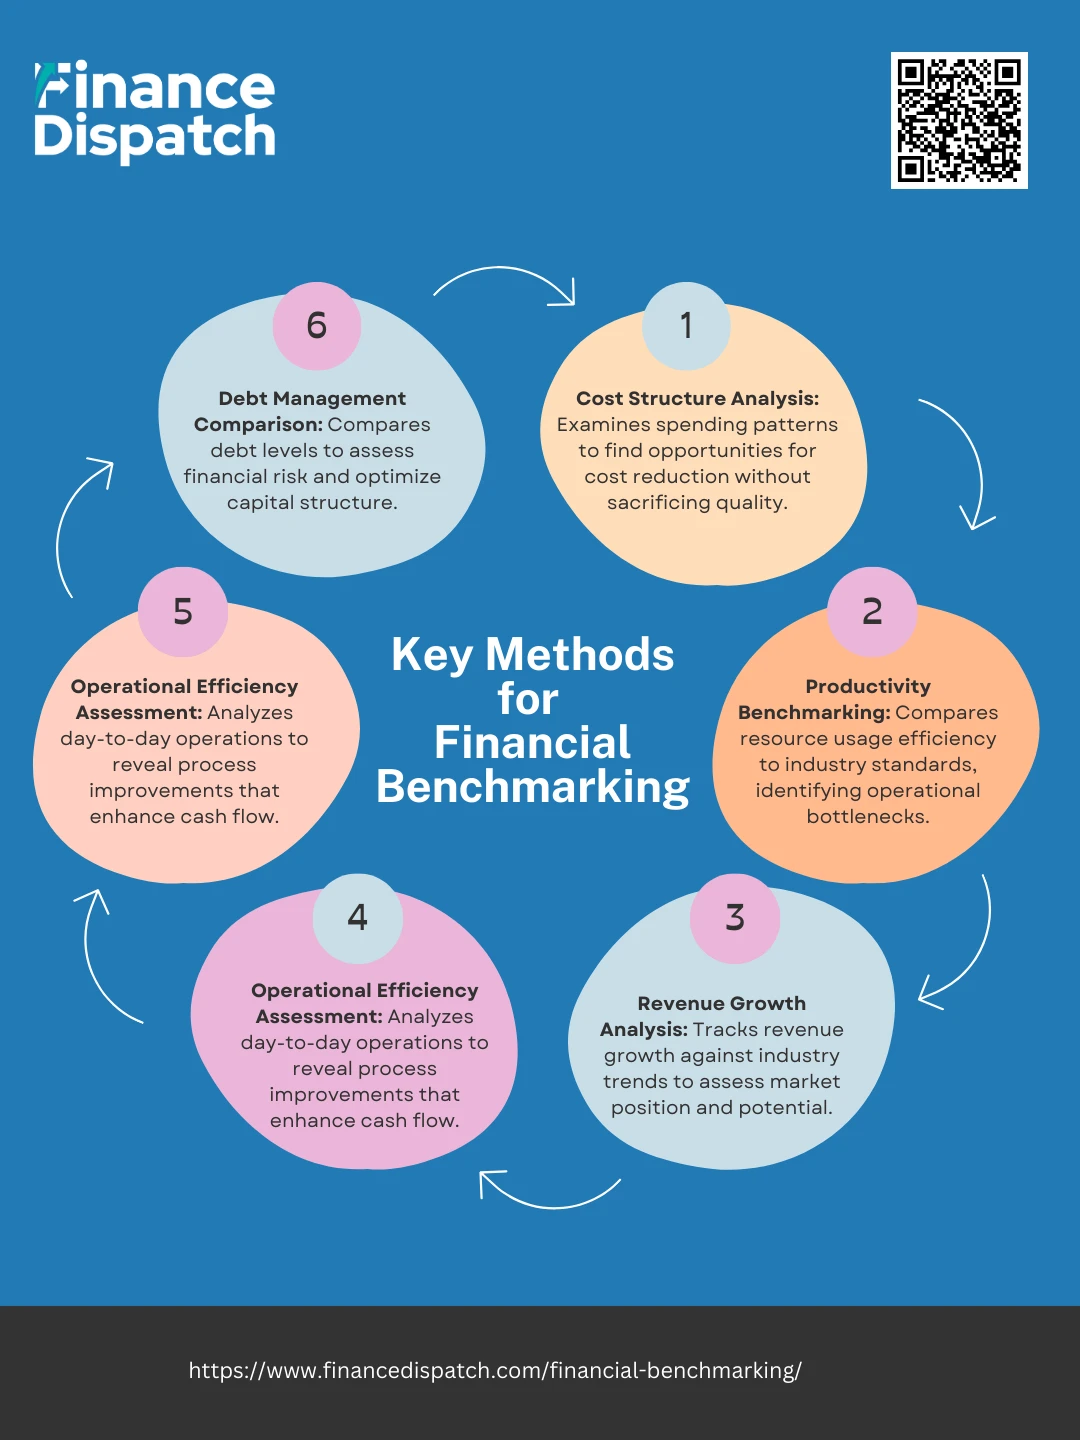
Financial benchmarking involves various methods that allow you to analyze and compare your company’s financial health to that of industry peers or internal benchmarks. Each method serves a unique purpose, from evaluating cost efficiency to identifying strategic gaps. By using the right benchmarking methods, you gain a clearer view of where your company excels, where it could improve, and how to make data-driven decisions that support sustainable growth. Here are some of the key methods for effective financial benchmarking:
1. Cost Structure Analysis
This method involves breaking down and comparing your company’s cost structure, including both direct costs (such as raw materials and labor) and indirect costs (like overhead). Cost structure analysis helps you see where you might be overspending or under-investing compared to industry norms. It’s particularly useful for finding ways to reduce expenses without compromising quality, which can improve your bottom line.
2. Financial Ratio Analysis
Financial ratios are essential indicators of a company’s financial health. By comparing ratios like profitability, liquidity, and leverage to industry standards, you can assess how well your company is managing its resources. For example, liquidity ratios help determine if you’re prepared to meet short-term obligations, while profitability ratios gauge how effectively you’re converting revenue into profit. Ratio analysis helps you pinpoint specific areas for improvement, such as increasing efficiency or reducing debt levels.
3. Productivity Benchmarking
This approach evaluates how efficiently your company uses resources, such as labor or equipment, relative to industry benchmarks. Productivity metrics, such as revenue per employee or output per machine, show whether your operations are running as smoothly as they should. Productivity benchmarking can highlight inefficiencies that may be holding back growth and profitability, enabling you to streamline processes and enhance overall performance.
4. Revenue Growth Analysis
Comparing your company’s revenue growth to industry standards can provide insight into your market position and growth potential. This method helps you see if you’re keeping up with industry growth trends or if you might be falling behind. Revenue growth analysis is especially useful for identifying new market opportunities or determining whether your current strategies are effectively supporting expansion.
5. Operational Efficiency Assessment
This method focuses on analyzing how well your company’s day-to-day operations align with industry best practices. Operational benchmarks, such as inventory turnover or accounts receivable turnover, reveal how efficiently you’re managing key processes. For example, a low inventory turnover might indicate that stock is moving too slowly, tying up capital. This assessment helps identify operational adjustments that can increase cash flow and enhance efficiency.
6. Debt Management Comparison
Evaluating your company’s debt levels in relation to industry benchmarks, such as the debt-to-equity ratio, provides insight into financial risk. By understanding how your debt compares to competitors’, you can assess whether your company is over-leveraged or well-positioned for future growth. This comparison allows you to make informed decisions about capital structure and debt repayment strategies.
Types of Financial Metrics Used in Benchmarking
Financial benchmarking relies on a variety of metrics that provide a comprehensive view of a company’s performance. These metrics cover areas like profitability, efficiency, liquidity, and debt management, each offering specific insights into different aspects of business health. By comparing these metrics against industry benchmarks or competitors, businesses can identify strengths, highlight areas for improvement, and create actionable plans for growth.
| Metric Type | Metric | Description |
| Profitability Metrics | Gross Profit Margin | Measures the difference between revenue and cost of goods sold, indicating how efficiently a company produces goods or services. |
| Net Profit Margin | Shows the percentage of revenue remaining after all expenses, reflecting overall profitability. | |
| Return on Assets (ROA) | Evaluates how effectively a company uses its assets to generate profit, essential for assessing operational efficiency. | |
| Return on Equity (ROE) | Indicates how well a company generates returns for its shareholders, useful for investor analysis. | |
| Efficiency Metrics | Inventory Turnover | Measures how often inventory is sold and replaced over a period, showing inventory management effectiveness. |
| Receivables Turnover | Assesses how quickly a company collects payments from customers, highlighting credit and collections efficiency. | |
| Asset Turnover Ratio | Reflects how well a company uses its assets to generate revenue, a key metric for operational performance. | |
| Liquidity Metrics | Current Ratio | Indicates a company’s ability to meet short-term obligations using its current assets, important for evaluating financial health. |
| Quick Ratio | Similar to the current ratio but excludes inventory, providing a stricter measure of liquidity. | |
| Leverage Metrics | Debt-to-Equity Ratio | Compares total debt to shareholder equity, offering insights into financial leverage and risk. |
| Interest Coverage Ratio | Measures a company’s ability to pay interest on its outstanding debt, indicating financial stability. | |
| Growth Metrics | Revenue Growth Rate | Tracks revenue increase over time, providing insight into market expansion and competitiveness. |
| 5-Year Compound Annual Growth Rate (CAGR) | Reflects the average annual growth rate over five years, valuable for assessing long-term business growth. |

Tools and Software Available for Financial Benchmarking
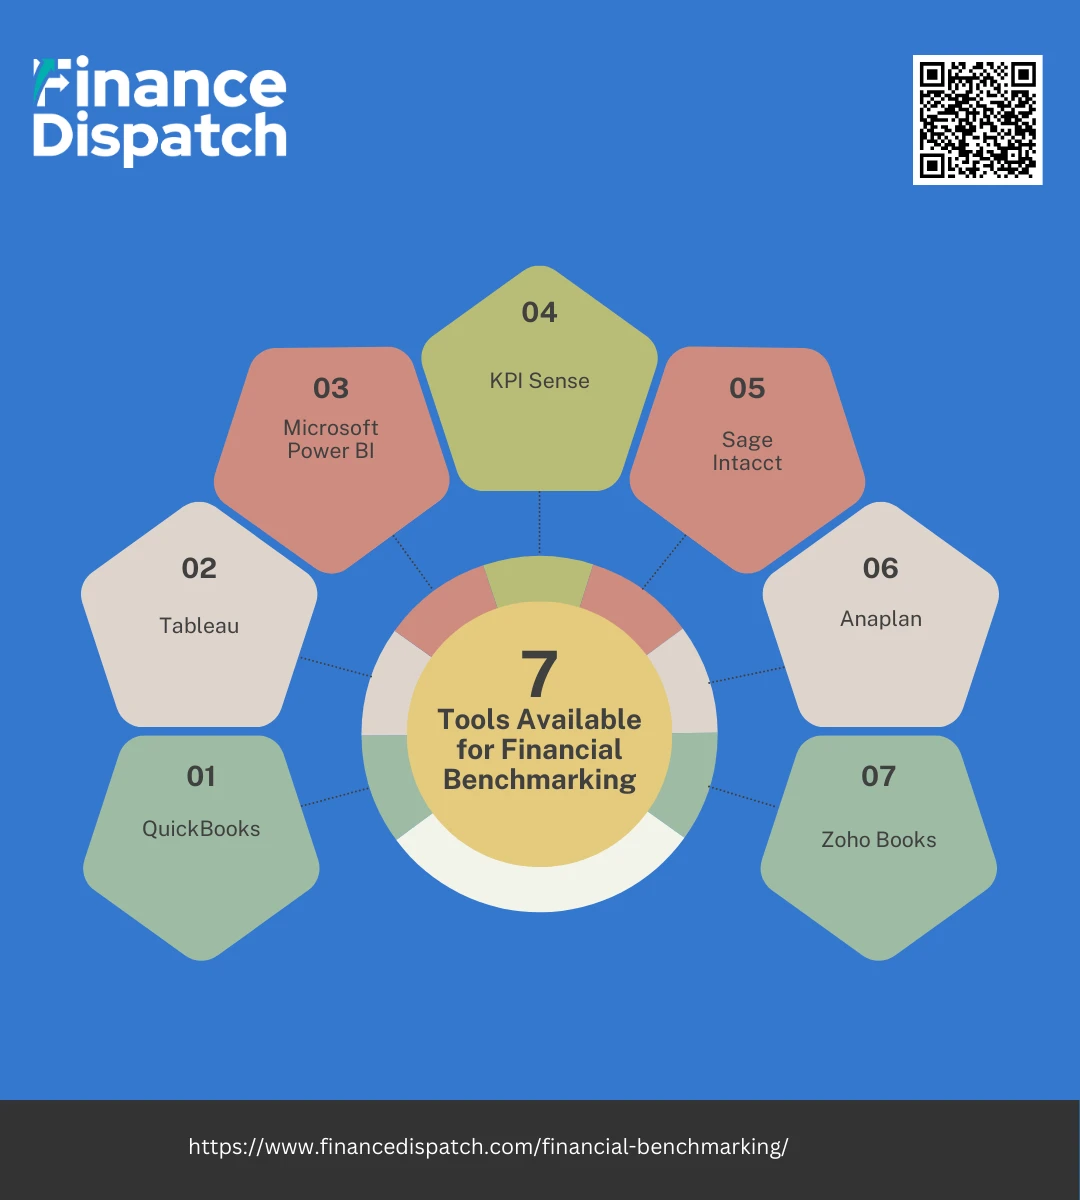
Financial benchmarking can be streamlined and enhanced with the right tools and software, which help organize data, conduct analyses, and visualize results effectively. These tools allow companies to automate data collection, compare metrics across industries, and gain actionable insights more efficiently. Here are some popular tools and software available for financial benchmarking:
1. QuickBooks
QuickBooks offers a range of accounting and benchmarking tools tailored for small to medium-sized businesses. With customizable reports and real-time dashboards, it allows businesses to track financial metrics, compare them against industry standards, and gain insights to improve cash flow and profitability.
2. Tableau
Tableau is a powerful data visualization tool that helps businesses turn raw financial data into easy-to-understand visual insights. Its capabilities for building interactive dashboards and custom charts make it ideal for displaying benchmarking metrics and helping teams understand performance trends.
3. Microsoft Power BI
Power BI provides robust business intelligence and data visualization capabilities, allowing companies to aggregate data from multiple sources. Its interactive reporting features make it easy to benchmark financial performance, compare industry metrics, and share insights with stakeholders across the organization.
4. KPI Sense
Specifically designed for financial performance tracking, KPI Sense helps companies set, monitor, and evaluate key financial benchmarks. The tool provides dashboards for tracking KPIs, comparing them with industry averages, and setting performance improvement goals.
5. Sage Intacct
Sage Intacct is a cloud-based financial management software that provides in-depth reporting and benchmarking functionalities. Its features include customizable financial dashboards, enabling companies to compare their performance metrics with industry benchmarks and make data-driven financial decisions.
6. Anaplan
Anaplan is a planning and performance management software that allows companies to forecast, model, and analyze financial data. It is highly customizable, making it suitable for complex benchmarking across multiple business units, helping businesses plan and adjust financial strategies in real-time.
7. Zoho Books
Zoho Books offers financial reporting and KPI tracking capabilities for small businesses. Its benchmarking features allow users to set up industry comparisons, monitor cash flow and revenue metrics, and make informed decisions based on up-to-date financial performance data.
Conclusion
In conclusion, financial benchmarking is a powerful tool that allows businesses to assess their performance, identify areas for improvement, and set realistic goals based on industry standards. By regularly comparing key financial metrics to competitors and industry averages, companies gain valuable insights into their strengths, weaknesses, and opportunities for growth. Financial benchmarking supports data-driven decision-making, enhances operational efficiency, and builds competitive advantage, making it an essential practice for any organization aiming for long-term success. Embracing benchmarking as a continuous process not only fosters resilience and adaptability but also instills confidence among stakeholders, ultimately contributing to a stronger, more strategic business foundation.
FAQs
1. How often should a company conduct financial benchmarking?
Regular benchmarking is recommended, ideally on an annual or semi-annual basis, to stay aligned with industry changes. However, companies undergoing rapid growth or facing significant market shifts may benefit from more frequent benchmarking to maintain a competitive edge.
2. What is the difference between internal and external financial benchmarking?
Internal benchmarking involves comparing financial metrics across different departments or divisions within the same company to improve efficiency. External benchmarking, on the other hand, compares a company’s performance to that of competitors or industry standards to gauge market position and identify areas for improvement.
3. How can small businesses effectively implement financial benchmarking?
Small businesses can start with basic financial metrics like revenue growth, profit margin, and liquidity ratios, using accessible tools like QuickBooks or Excel. They can also refer to industry reports or trade associations for data on industry standards, allowing them to benchmark without needing costly, specialized software.
4. What are some challenges specific to benchmarking across different industries?
Different industries have unique cost structures, growth rates, and market demands, which can complicate cross-industry benchmarking. Adjustments for these variances are necessary, as direct comparisons may not yield actionable insights without context specific to each industry’s norms.
5. Can financial benchmarking be used to improve employee performance?
Yes, benchmarking can indirectly enhance employee performance by setting clear, realistic financial goals that align with industry standards. When employees understand these targets and how their roles contribute, it fosters accountability and motivation, leading to improved productivity and a stronger overall company performance.


