The stock market is a dynamic and ever-changing landscape where investors constantly seek ways to predict price movements and maximize their returns. One of the most widely used methods for forecasting stock trends is technical analysis—a strategy that relies on historical price data, volume, and market patterns to make informed trading decisions. Unlike fundamental analysis, which evaluates a company’s financial health, technical analysis focuses on charts, indicators, and price trends to identify potential buy and sell opportunities. But how do these charts actually help predict stock movements? In this article, we’ll explore the principles of technical analysis, the different types of stock charts, and how traders use them to anticipate market trends with confidence.
What is Technical Analysis?
Technical analysis is a method of evaluating securities by analyzing historical price movements, trading volume, and market trends. It operates on the principle that all relevant information about a stock, including investor sentiment and economic factors, is already reflected in its price. Unlike fundamental analysis, which focuses on a company’s financial statements and intrinsic value, technical analysis relies on charts, indicators, and patterns to forecast future price movements. Traders and analysts use this approach to identify trends, support and resistance levels, and potential entry or exit points for trades. By studying past market behavior, technical analysts aim to predict how stocks will move, making it a popular tool for short-term traders and investors looking to capitalize on price fluctuations.
 Key Principles of Technical Analysis
Technical analysis is based on the idea that past price movements can help predict future trends. It relies on studying charts, market patterns, and various indicators to understand the behavior of stocks and other financial instruments. Traders use technical analysis to identify opportunities and manage risks effectively. While there are many tools and techniques, the foundation of technical analysis rests on a few core principles that guide decision-making in the market.
Key Principles of Technical Analysis
1. Market Discounts Everything
Technical analysis assumes that all known information—economic data, company performance, and market sentiment—is already reflected in the stock price. This means traders can focus solely on price movements rather than external factors.
2. Price Moves in Trends
Stock prices tend to move in identifiable trends—uptrend, downtrend, or sideways trend. Understanding these trends helps traders make informed decisions about when to enter or exit trades.
3. History Tends to Repeat Itself
Market movements are influenced by human emotions like fear and greed, which often result in recurring price patterns. Technical analysts study historical patterns to anticipate future price behavior.
4. Support and Resistance Levels Matter
Prices often bounce off specific levels called support (where demand increases) and resistance (where supply increases). Identifying these levels helps traders set stop-loss and profit-taking points.
5. Volume Confirms Price Trends
A price movement backed by high trading volume is considered more reliable than one with low volume. Rising volume in an uptrend confirms strength, while declining volume may signal a reversal.
6. Trends Continue Until Reversed
A trend remains in effect until clear signals indicate its reversal. Traders look for breakouts, breakdowns, and trendline violations to confirm changes in market direction.
 How Technical Analysis Works
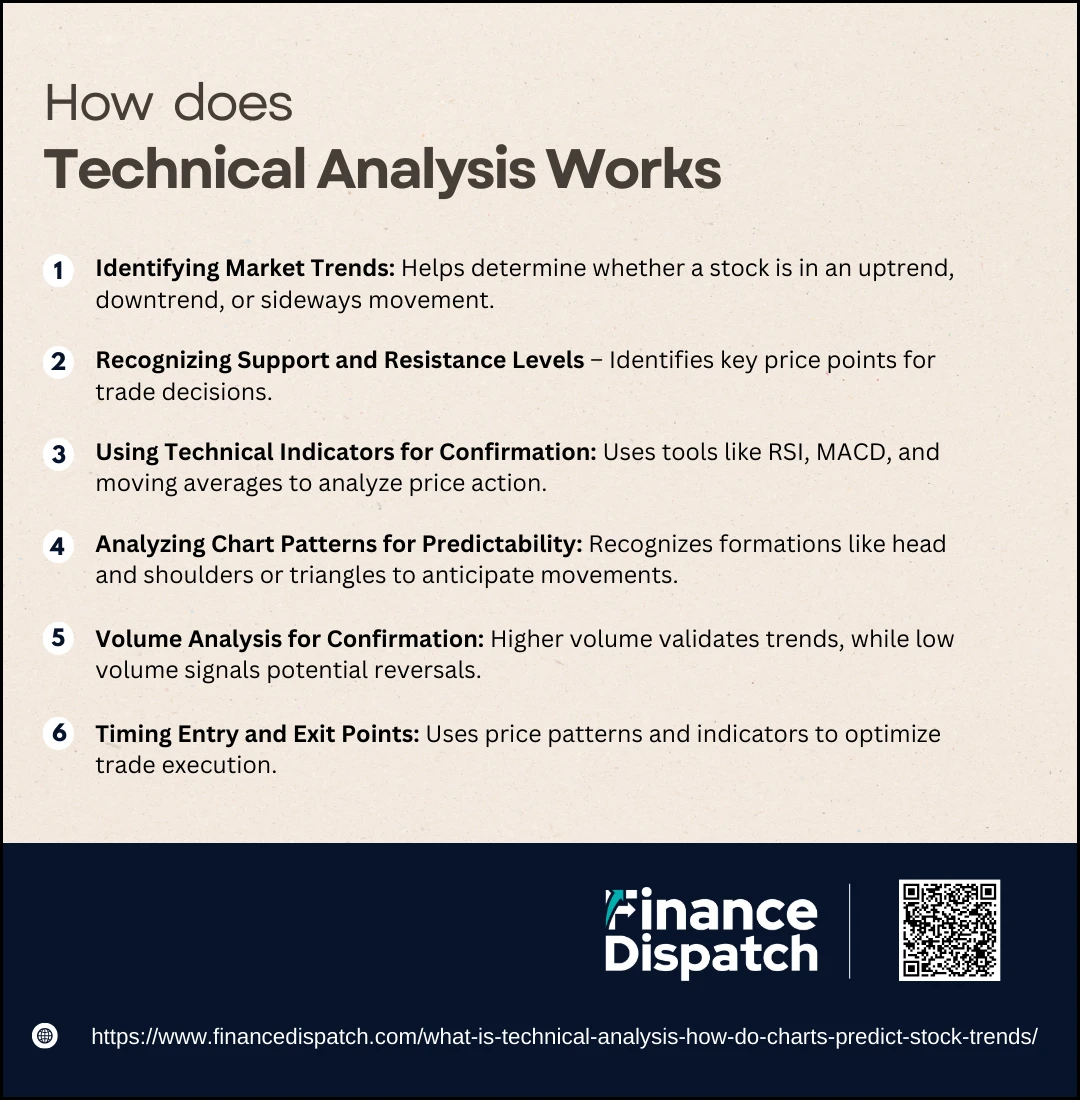
Technical analysis is a trading method that evaluates historical price movements and trading volume to forecast future market trends. It is based on the idea that price patterns tend to repeat over time due to investor psychology and market behavior. By studying charts, technical indicators, and market trends, traders can identify key signals that suggest when to buy or sell an asset. Unlike fundamental analysis, which focuses on a company’s earnings, financial statements, and economic factors, technical analysis strictly relies on price action, market sentiment, and statistical patterns to make trading decisions. Below are some of the core ways technical analysis helps traders navigate the stock market.
How Technical Analysis Helps Traders:
1. Identifying Market Trends
One of the fundamental aspects of technical analysis is recognizing whether a stock is in an uptrend, downtrend, or sideways trend. Uptrends signal strong buying pressure, downtrends indicate selling pressure, and sideways trends suggest market indecision. Understanding these trends allows traders to position their trades in the direction of momentum.
2. Recognizing Support and Resistance Levels
Support and resistance are key price levels where stocks tend to reverse direction or consolidate. Support is a price level where demand increases, preventing the stock from falling further. Resistance is a level where selling pressure is strong enough to prevent further price increases. Identifying these levels helps traders set stop-loss orders and profit targets.
3. Using Technical Indicators for Confirmation
Various technical indicators assist traders in understanding market strength and momentum. Some of the most commonly used indicators include:
- Moving Averages (SMA, EMA) – Helps smooth out price fluctuations to determine trend direction.
- Relative Strength Index (RSI) – Identifies overbought and oversold conditions.
- MACD (Moving Average Convergence Divergence) – Measures momentum and trend changes.
- Bollinger Bands – Shows volatility and potential price breakouts.
4. Analyzing Chart Patterns for Predictability
Chart patterns provide visual representations of price action, helping traders anticipate future movements. Common chart patterns include:
-
- Head and Shoulders – Signals a potential trend reversal.
- Double Tops and Double Bottoms – Indicate strong resistance or support breakouts.
- Triangles (Ascending, Descending, Symmetrical) – Suggest upcoming breakout directions.
5. Volume Analysis for Confirmation
Volume plays a crucial role in validating price movements. If a stock price is rising with increasing volume, it indicates strong buying interest. Conversely, if a stock price is moving up or down with low volume, it may suggest weak momentum and potential reversals.
6. Timing Entry and Exit Points
Technical analysis helps traders identify the best times to enter or exit trades. By analyzing price movements and using tools like candlestick patterns, moving averages, and oscillators, traders can spot the optimal price levels to maximize profits while minimizing risk.
 How Stock Charts Help Predict Trends
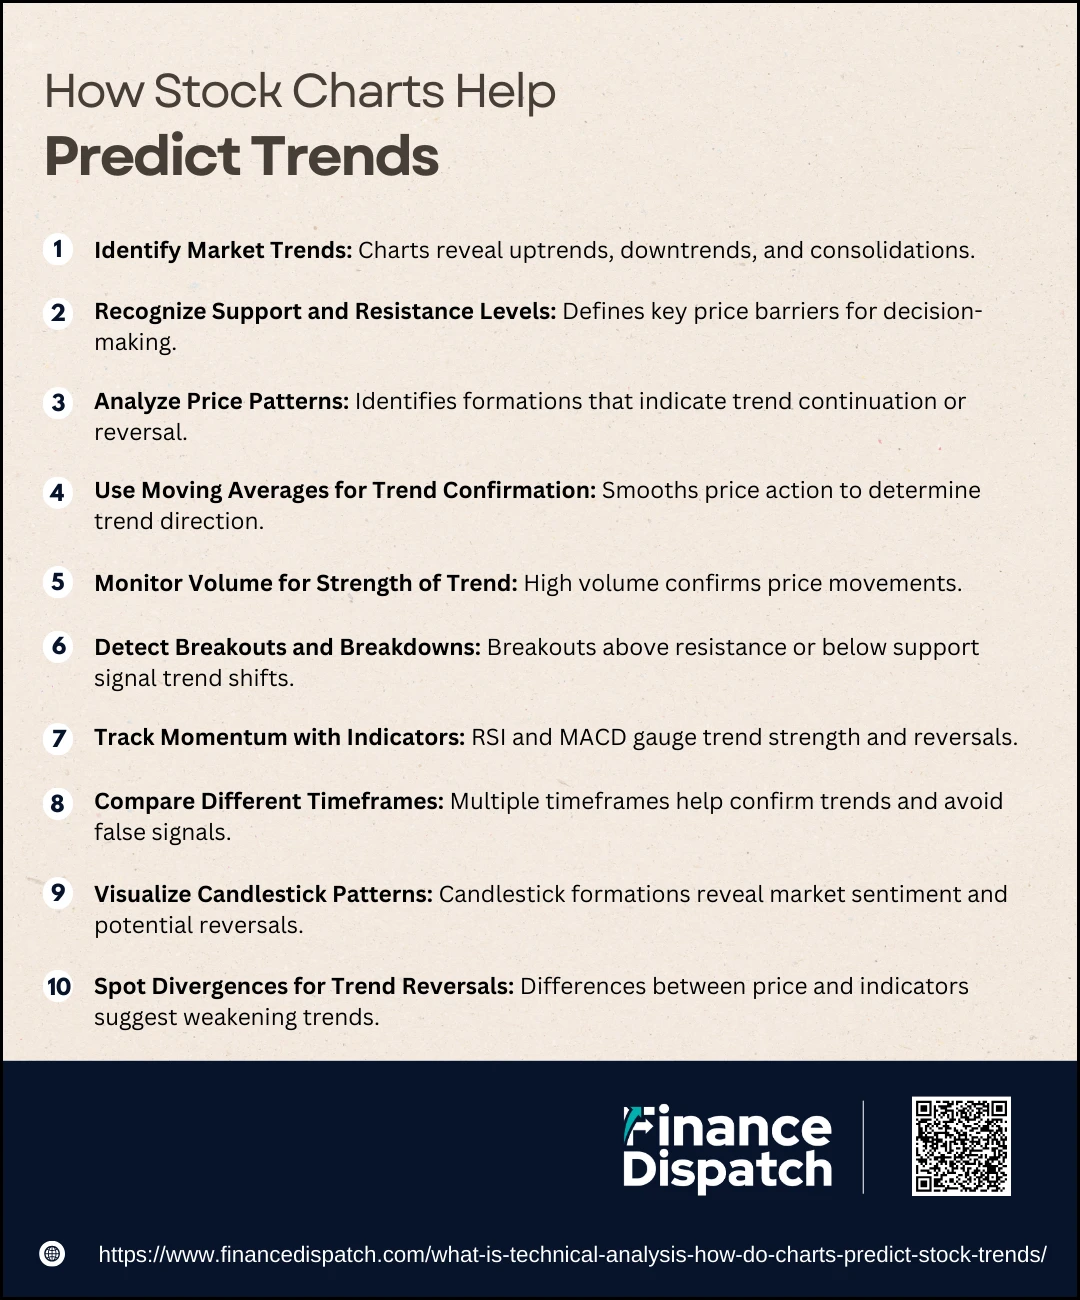
Stock charts are one of the most powerful tools traders use to analyze market trends and predict future price movements. These charts visually represent historical price data, allowing traders to identify patterns, trends, and key support and resistance levels. By studying different types of charts and technical indicators, traders can make informed decisions about when to enter or exit trades. Below are the key ways stock charts help predict trends.
Ways Stock Charts Help Predict Trends
1. Identify Market Trends
Stock charts help traders determine whether a stock is in an uptrend, downtrend, or sideways trend. An uptrend consists of higher highs and higher lows, while a downtrend shows lower highs and lower lows. Recognizing these trends early allows traders to adjust their strategies accordingly, either riding the trend or preparing for reversals.
2. Recognize Support and Resistance Levels
Support and resistance levels are key price points where stocks tend to reverse or consolidate. Support acts as a floor, preventing prices from falling further, while resistance acts as a ceiling, restricting further price increases. Traders use these levels to set stop-loss orders, entry points, and profit targets.
3. Analyze Price Patterns
Stock charts reveal common price patterns such as head and shoulders, double tops, and triangles, which help predict future price movements. These patterns indicate whether a trend will continue or reverse, providing traders with actionable insights. Recognizing and acting on these patterns early can improve the accuracy of trade predictions.
4. Use Moving Averages for Trend Confirmation
Moving averages smooth out price fluctuations to help traders identify the overall trend direction. A stock trading above its 50-day or 200-day moving average is typically considered to be in an uptrend. Moving average crossovers, such as the golden cross (bullish) or death cross (bearish), confirm trend shifts.
5. Monitor Volume for Strength of Trend
Volume analysis helps traders confirm whether a price movement is strong or weak. A rising stock price with increasing volume suggests strong buying interest, while low volume may indicate a lack of conviction. Sudden spikes in volume often signal potential breakouts or reversals.
6. Detect Breakouts and Breakdowns
Breakouts occur when a stock price moves above resistance, while breakdowns happen when it falls below support. These movements indicate a strong shift in market sentiment, leading to potential rapid price changes. Traders use breakouts and breakdowns to time their entries and exits effectively.
7. Track Momentum with Indicators
Momentum indicators such as Relative Strength Index (RSI) and MACD help traders gauge trend strength and potential reversals. A stock with an RSI above 70 is considered overbought and may correct, while one below 30 is oversold and may rebound. MACD crossovers further confirm bullish or bearish momentum shifts.
8. Compare Different Timeframes
Analyzing multiple timeframes (daily, weekly, and monthly) provides a broader perspective on market trends. A stock may show an uptrend in the short term but a downtrend in the long term, requiring traders to align their strategies accordingly. Comparing timeframes helps in identifying false signals and market noise.
9. Visualize Candlestick Patterns
Candlestick charts display price action in a visually intuitive way, helping traders interpret market sentiment. Patterns like doji, engulfing, and hammer indicate potential reversals or continuations. Learning candlestick formations allows traders to anticipate market movements with greater accuracy.
10. Spot Divergences for Trend Reversals
A divergence occurs when a stock’s price moves in one direction while an indicator moves in the opposite direction. For example, if the price makes new highs but RSI fails to do the same, it signals weakening momentum and a possible reversal. Spotting divergences early helps traders exit trades before a trend change occurs.
 Common Chart Patterns in Technical Analysis
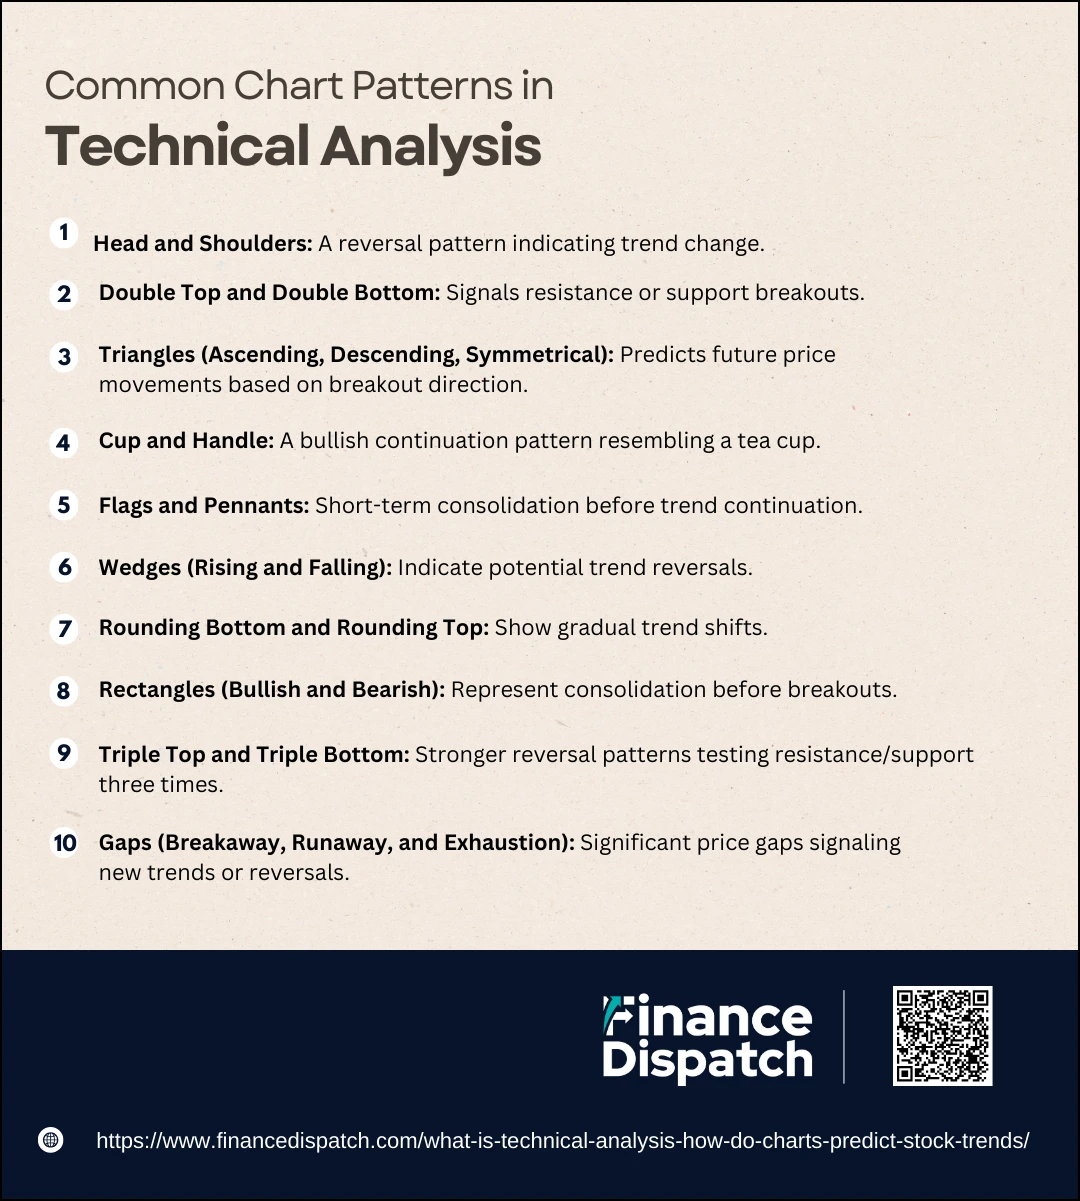
Chart patterns are a fundamental component of technical analysis, helping traders anticipate potential price movements based on historical trends. These patterns form due to repeated investor behavior and can indicate whether a stock is likely to continue its current trend or reverse direction. Traders use these formations alongside technical indicators to confirm their predictions and make strategic trading decisions. Below are some of the most common chart patterns in technical analysis and how they help in forecasting price movements.
Common Chart Patterns in Technical Analysis
1. Head and Shoulders
This is a classic reversal pattern that signals a potential change in trend. It consists of three peaks: a higher middle peak (head) and two lower peaks (shoulders) on either side. When the price breaks below the neckline (a support level connecting the lows of the shoulders), it confirms a bearish reversal. The inverse head and shoulders pattern works the same way but signals a bullish reversal.
2. Double Top and Double Bottom
A double top is a bearish reversal pattern that forms when the price reaches a resistance level twice but fails to break through, leading to a downward movement. A double bottom, on the other hand, is a bullish reversal pattern where the price tests support twice and then rebounds upward, signaling strong buying pressure.
3. Triangles (Ascending, Descending, and Symmetrical)
Triangles represent periods of price consolidation before a breakout.
- Ascending triangles are bullish and occur when higher lows form along a rising support line, indicating increasing buying pressure.
- Descending triangles are bearish and form when lower highs occur against a flat support line, signaling downward momentum.
- Symmetrical triangles can break in either direction, depending on the prevailing trend and volume confirmation.
4. Cup and Handle
A bullish continuation pattern that resembles the shape of a tea cup. The cup forms when the stock price gradually declines and then rises, creating a rounded bottom. The handle appears as a small consolidation before the stock breaks out to higher levels. This pattern often signals the continuation of an uptrend.
5. Flags and Pennants
These are short-term continuation patterns that appear after strong price movements.
- Flags are rectangular consolidations where the price moves sideways after a sharp rally or drop before continuing in the same direction.
- Pennants are small triangular formations that also indicate a pause before the trend resumes. These patterns suggest brief consolidations before a strong breakout.
6. Wedges (Rising and Falling)
- Rising wedges signal bearish reversals. The price moves upward with converging trend lines, but buying pressure weakens, leading to a breakdown.
- Falling wedges indicate bullish reversals, where the price moves downward but gradually loses selling momentum, leading to a breakout.
7. Rounding Bottom and Rounding Top
- Rounding bottoms suggest a slow shift from a bearish to a bullish trend, often leading to sustained upward movement.
- Rounding tops indicate the opposite, where a stock gradually loses momentum and starts declining, signaling a bearish reversal.
8. Rectangles (Bullish and Bearish)
These patterns form when the price trades within a horizontal range, bouncing between support and resistance levels.
- A bullish rectangle signals accumulation, where buyers slowly gain control before an upward breakout.
- A bearish rectangle suggests distribution, where sellers dominate before a downward breakout.
9. Triple Top and Triple Bottom
These patterns are similar to double tops and double bottoms, but they test resistance or support three times instead of twice, making them stronger reversal signals. A triple top signals a bearish reversal after failing at resistance thrice, while a triple bottom indicates a bullish reversal after bouncing from support three times.
10. Gaps (Breakaway, Runaway, and Exhaustion)
Gaps occur when a stock opens significantly higher or lower than its previous close, often due to major news or earnings announcements.
- Breakaway gaps signal the beginning of a new trend.
- Runaway gaps appear in the middle of a strong trend and indicate continued momentum.
- Exhaustion gaps occur near the end of a trend, signaling potential reversals as traders take profits.
Technical Indicators and Their Role in Predicting Stock Movements
Technical indicators are essential tools in stock market analysis, helping traders and investors interpret price movements and make informed trading decisions. These indicators use mathematical calculations based on historical price, volume, and market trends to identify potential entry and exit points. By analyzing trends, momentum, volatility, and volume, technical indicators provide insights into whether a stock is overbought, oversold, or likely to continue its trend. Below is a table outlining key technical indicators and their roles in predicting stock movements.
Key Technical Indicators and Their Roles
| Indicator | Type | Purpose | How It Helps Traders |
| Moving Averages (SMA & EMA) | Trend | Identifies overall trend direction | Smooths out price fluctuations to show long-term and short-term trends |
| Relative Strength Index (RSI) | Momentum | Measures overbought/oversold conditions | RSI above 70 suggests overbought conditions; below 30 suggests oversold conditions |
| Moving Average Convergence Divergence (MACD) | Trend/Momentum | Confirms trend strength and reversals | MACD crossovers indicate buy/sell signals; divergence suggests trend changes |
| Bollinger Bands | Volatility | Measures price volatility and potential breakouts | Price touching upper band suggests overbought; lower band suggests oversold |
| Stochastic Oscillator | Momentum | Identifies momentum shifts | Readings above 80 indicate overbought; below 20 indicate oversold |
| On-Balance Volume (OBV) | Volume | Confirms trend strength using volume data | Rising OBV confirms an uptrend; declining OBV suggests a downtrend |
| Fibonacci Retracement | Support/Resistance | Identifies potential reversal levels | Traders use key Fibonacci levels (23.6%, 38.2%, 50%, 61.8%) to predict retracements |
| Average True Range (ATR) | Volatility | Measures market volatility | A high ATR suggests high volatility; a low ATR suggests a stable market |
| Parabolic SAR | Trend | Determines trend direction and reversals | Dots below price indicate an uptrend; dots above price suggest a downtrend |
| Commodity Channel Index (CCI) | Momentum | Identifies overbought/oversold conditions | Values above +100 indicate overbought; below -100 indicate oversold |

Advantages and Limitations of Technical Analysis
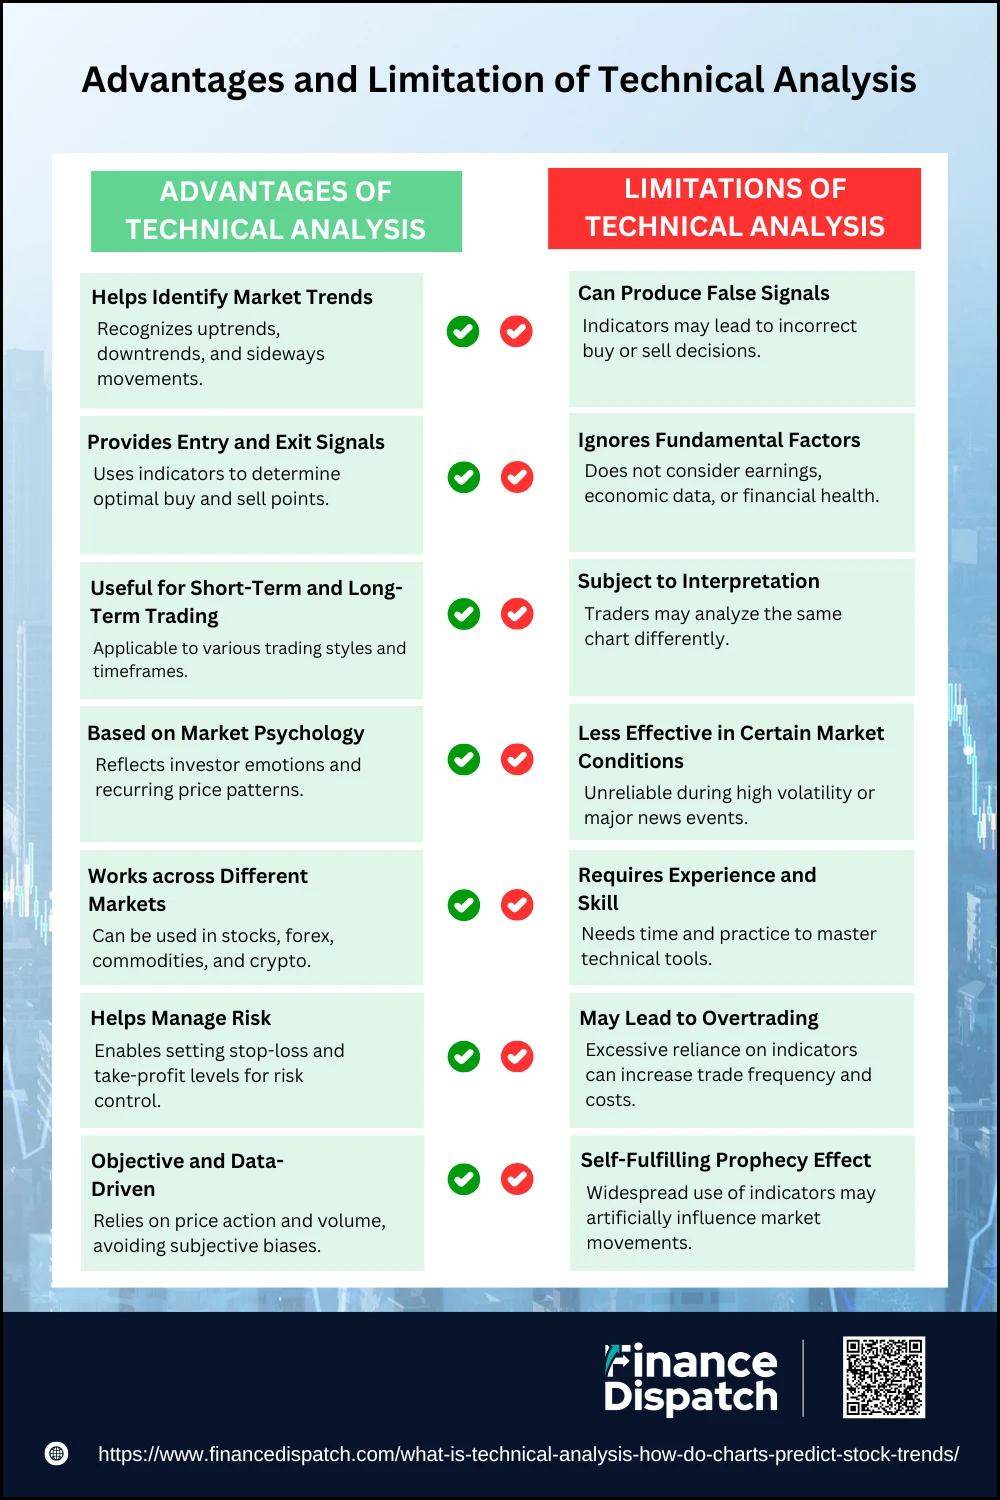
Technical analysis is a widely used approach for evaluating stock price movements based on historical data, trends, and market patterns. It helps traders understand price action, predict future movements, and make informed decisions by identifying entry and exit points, support and resistance levels, and potential trend reversals. Unlike fundamental analysis, which focuses on a company’s financial health, technical analysis primarily relies on charts, indicators, and market psychology. However, while it offers numerous benefits, it also has limitations that traders must consider. Below is a detailed breakdown of the advantages and limitations of technical analysis.
Advantages of Technical Analysis
1. Helps Identify Market Trends
Technical analysis enables traders to recognize whether a stock is in an uptrend, downtrend, or sideways trend. By understanding these trends, traders can align their positions with the overall market direction and avoid making trades that go against momentum.
2. Provides Entry and Exit Signals
By using indicators like Moving Averages, Relative Strength Index (RSI), and MACD, traders can determine optimal buying and selling points. These signals help traders time their trades effectively, maximizing profits and minimizing losses.
3. Useful for Short-Term and Long-Term Trading
Technical analysis is highly adaptable and can be applied to various trading styles, including day trading, swing trading, and long-term investing. Whether analyzing short-term price fluctuations or long-term trends, traders can use technical tools to refine their strategies.
4. Based on Market Psychology
Technical analysis reflects investor behavior and emotions such as fear, greed, and market sentiment. Since human psychology tends to be repetitive, price patterns and trends form consistently, allowing traders to take advantage of predictable price movements.
5. Works across Different Markets
One of the biggest strengths of technical analysis is its versatility. It can be applied to various asset classes, including stocks, commodities, forex, cryptocurrencies, and indices, making it a universal tool for financial market analysis.
6. Helps Manage Risk
Technical analysis allows traders to set stop-loss and take-profit levels based on support and resistance zones. This helps minimize potential losses and enhances risk management, ensuring that traders can control their exposure in volatile markets.
7. Objective and Data-Driven
Unlike fundamental analysis, which involves subjective evaluations of financial statements, technical analysis relies purely on price action and volume data. This objective approach makes it easier for traders to identify patterns and trends without being influenced by emotions or opinions.
Limitations of Technical Analysis
1. Can Produce False Signals
Technical indicators and patterns are not always accurate and can generate false buy or sell signals. For example, a stock may break above resistance but quickly reverse, leading to a false breakout and potential losses for traders.
2. Ignores Fundamental Factors
Technical analysis does not consider a company’s earnings, financial health, economic data, or macroeconomic trends. While technical tools help predict short-term price movements, long-term investors often rely on fundamental analysis to assess a company’s true value.
3. Subject to Interpretation
Different traders may analyze the same chart differently, leading to varied conclusions and inconsistent decision-making. Some traders might see a bullish pattern, while others may interpret the same chart as bearish, causing uncertainty in trading strategies.
4. Less Effective in Certain Market Conditions
During periods of high volatility, sudden news events, or economic crises, price movements may not follow predictable trends or patterns. In such cases, technical analysis can become unreliable, and price action may be driven by external factors rather than historical trends.
5. Requires Experience and Skill
Learning technical analysis takes time and practice. New traders may struggle to interpret complex charts, indicators, and price action, leading to poor trading decisions. Mastering technical analysis requires continuous learning and the ability to adapt to changing market conditions.
6. May Lead to Overtrading
Over-reliance on technical indicators can encourage excessive trading, where traders execute too many trades based on frequent signals. Overtrading not only increases transaction costs but also reduces profitability by exposing traders to more risk.
7. Self-Fulfilling Prophecy Effect
When many traders follow the same technical indicators (such as Moving Averages or Fibonacci Retracements), price movements can become self-fulfilling. This means that traders collectively influence the market by placing trades based on these signals, rather than the indicators being inherently predictive.
Conclusion
Technical analysis is a valuable tool for traders and investors, offering insights into market trends, price patterns, and potential trading opportunities. By relying on historical price data, chart patterns, and technical indicators, traders can make informed decisions about entry and exit points. However, it is essential to recognize its limitations, including the potential for false signals, reliance on historical data, and market unpredictability. While technical analysis can be highly effective, it should not be used in isolation. Combining it with risk management strategies, fundamental analysis, and market awareness can enhance trading success. Ultimately, the key to successful trading lies in continuous learning, adaptability, and disciplined execution of strategies.


